
Restaurant unit economics: modelling a 15% increase in repeat visits
Model how a 15% repeat-visit scenario affects restaurant sales and contribution after margin, rewards, capacity, cannibalisation and programme costs.

A 15% relative increase in repeat visits can improve restaurant unit economics, but it is a scenario, not an industry benchmark. Its value depends on the existing repeat-visit share, average order value, incremental gross margin, available capacity, cannibalisation and reward cost. Model extra contribution transparently, then validate causality with a control group before claiming an uplift.
A 15% repeat-visit increase is an economic scenario, not a universal result
Restaurant customer retention should be treated as an operating lever because another genuinely incremental visit can spread acquisition expenditure across more transactions and generate contribution without requiring another first-time customer. That does not make 15% a tipping point or a guaranteed profitability threshold. No authoritative source reviewed establishes a 15% increase in repeat visits as a universal restaurant benchmark.
The first task is to define the number. “15% more repeat visits” could mean:
- A 15% relative increase: 100 repeat visits become 115.
- A 15 percentage-point increase in repeat rate: a repeat rate moves from 40% to 55%, which is a much larger change.
- A 15% increase among identified members: the result applies only to a measured cohort and cannot be extended to anonymous restaurant traffic without evidence.
A visit also needs a fixed definition. State the customer identifier, repeat window, location and channel coverage, observation period, refund treatment and whether staff, tests, store openings or closures are excluded. Without those definitions, the headline percentage cannot support a restaurant unit economics decision.
Repeat visits improve unit economics only when they are incremental and profitable
Restaurant unit economics describes revenue and cost behaviour for one location, order or customer cohort. The decision metric is incremental contribution, not gross sales.
A repeat visit is a subsequent qualifying visit by the same defined customer within a stated window. A payment credential is not automatically a person because wallets and cards may present different credentials. EMVCo’s payment tokenisation explanation confirms that tokens may be restricted by merchant, device or payment scenario.
Average order value (AOV) is sales divided by qualifying orders. Gross margin is sales less cost of goods sold, not full incremental contribution. Cannibalisation is demand that replaces another full-price visit or shifts from another channel or group location. Capacity realisation is the share of modelled demand the restaurant can serve without displacing higher-value demand.
Public filings show why traffic and ticket must be separated. Chipotle’s FY2025 comparable transactions fell 2.9% while average check rose 1.2%, according to its FY2025 Form 10-K. Darden reported that Olive Garden guest counts fell 2.3% while average check rose 4.1%, whereas LongHorn guest counts and average check both rose, in its FY2025 Form 10-K. These disclosures do not prove loyalty causality.
The transparent formula starts with visits, then deducts every marginal cost
Use a visit-based model when counts and AOV are available:

V= baseline annual visitsr= baseline share of visits made by repeat customersu= relative uplift in repeat visits, such as 15% or0.15q= capacity realisation ratek= cannibalisation or displacement rateA= baseline AOV for the relevant repeat cohorta= percentage change in AOV on incremental visitsg= gross margin percentageL= incremental labour costP= incremental packaging, payment and channel costR= reward and discount costF= incremental programme and fulfilment costC= incremental capacity cost
Raw additional repeat visits = V × r × u
Net incremental visits = V × r × u × q × (1-k)
Incremental sales = Net incremental visits × A × (1+a)
Incremental contribution = Incremental sales × g - L - P - R - F - C
Do not deduct the same item twice. If an analyst uses a consolidated incremental contribution margin after food, marginal labour, packaging, payment and channel costs, the model becomes:
Incremental contribution = Incremental sales × incremental contribution margin - R - F - C
For customer lifetime value in a restaurant, a practical cohort formula is:
Customer lifetime contribution = contribution per order × visit frequency × measured customer lifespan - acquisition and programme costs
If contribution per order is unavailable, estimate it as AOV × contribution-margin rate, then apply the same frequency and lifespan terms.
This is more decision-useful than LTV = AOV × frequency × lifespan because the simpler formula is revenue, not economic value.
The sensitivity range shows why the same 15% can produce very different outcomes
Assume a restaurant has £1 million of annual sales, unchanged AOV and a genuine 15% relative increase in repeat visits. Before capacity and cannibalisation, the sales effect equals the repeat-derived share of baseline visits multiplied by 15%.
- Repeat-derived share of baseline visits
- Conservative case: 40%
- Base case: 60%
- Upside case: 80%
- What to verify: Identity coverage and cohort definition
- Gross sales effect before constraints
- Conservative case: 6%
- Base case: 9%
- Upside case: 12%
- What to verify: Relative uplift, not percentage points
- Capacity realisation
- Conservative case: 70%
- Base case: 90%
- Upside case: 100%
- What to verify: Daypart seats, kitchen throughput and service time
- Cannibalisation or displacement
- Conservative case: 30%
- Base case: 15%
- Upside case: 5%
- What to verify: Channel, location and full-price substitution
- Net incremental sales
- Conservative case: £29,400
- Base case: £68,850
- Upside case: £114,000
- What to verify: £1m × share × 15% × capacity × (1-cannibalisation)
- Incremental contribution margin before rewards
- Conservative case: 18%
- Base case: 25%
- Upside case: 32%
- What to verify: Food, marginal labour, packaging, payment and channel costs
- Contribution before rewards and programme cost
- Conservative case: £5,292
- Base case: £17,213
- Upside case: £36,480
- What to verify: Do not use blended restaurant margin without checking marginal costs
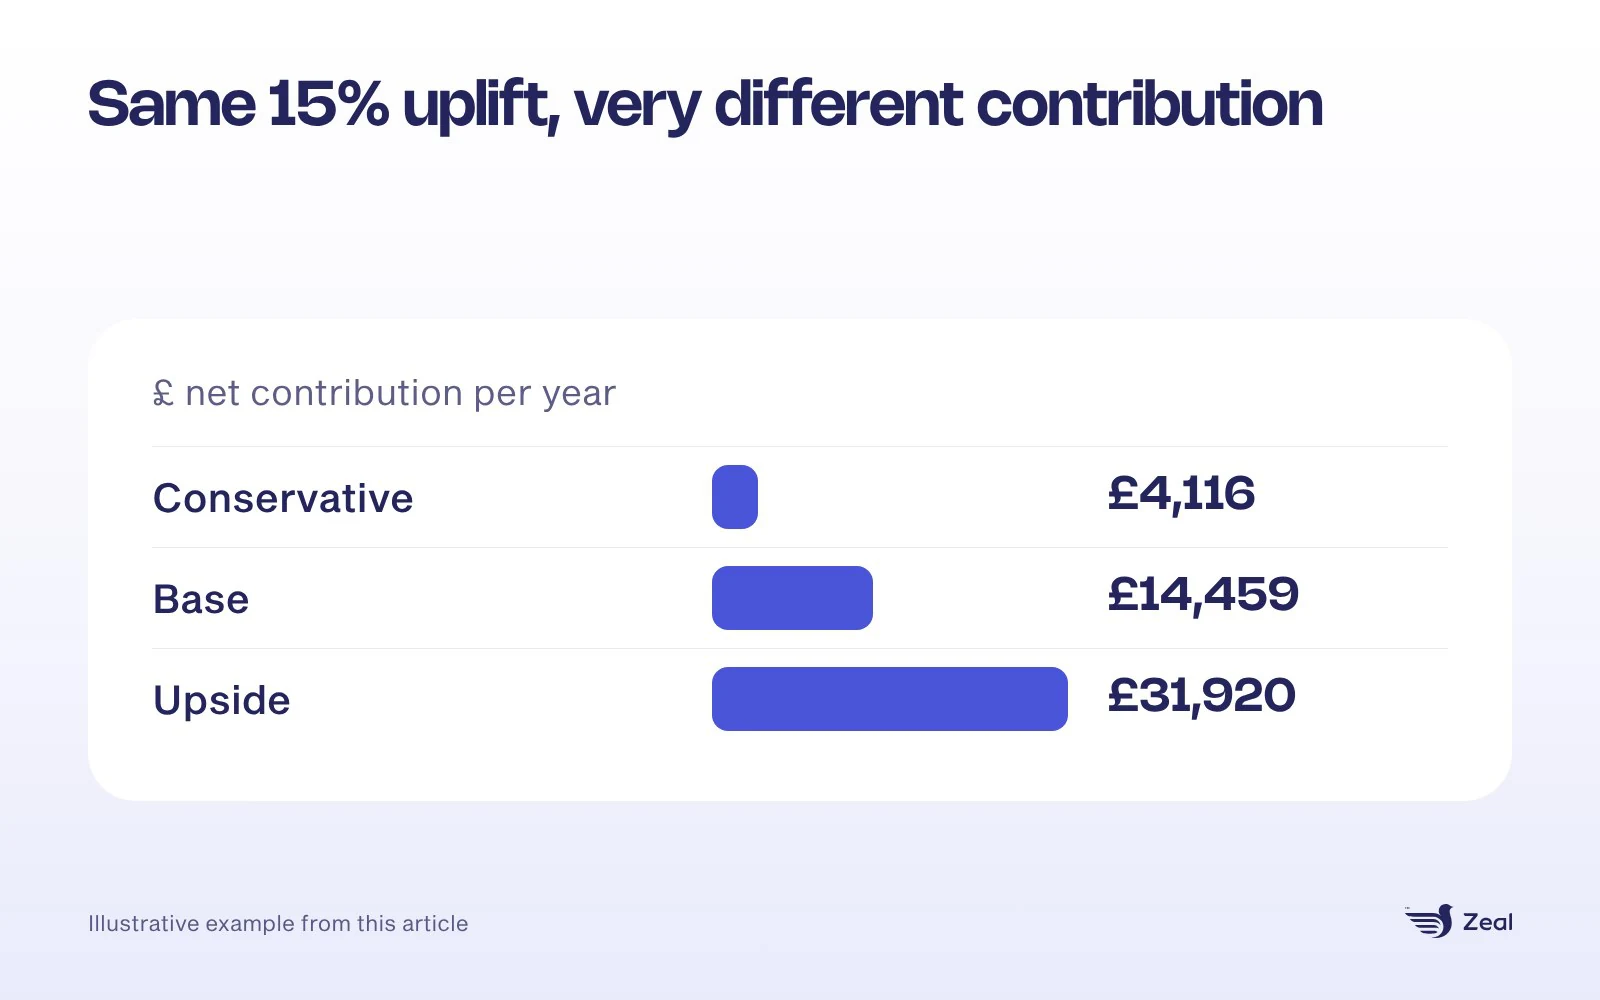
Reward cost must then be deducted. If rewards, discounts and variable programme fulfilment cost equal 4% of incremental sales, the three cases lose £1,176, £2,754 and £4,560 respectively. Net contribution becomes about £4,116, £14,459 and £31,920 before any additional capacity investment. These are illustrative calculations, not forecasts or Zeal results.
The model also explains why a 15% visit lift does not automatically offset a 10% labour-cost increase. The correct comparison is:
Incremental contribution after all variable costs versus additional annual labour cost on the affected unit
If annual labour cost rises by £30,000, the base scenario above does not offset it. The upside scenario narrowly does before fixed programme cost. The answer changes with AOV, labour intensity, daypart capacity and reward design, so the labour claim must be calculated per unit rather than asserted generally.
A shift from higher-cost third-party delivery to direct or in-store demand helps only if value and convenience survive. Keep channel-mix contribution separate from net-new traffic.
Capacity and cannibalisation determine whether demand becomes contribution
At an underused weekday daypart, incremental orders may use existing rent, management and equipment with limited extra fixed cost. At a full Saturday peak, the same offer may displace a full-price guest, lengthen queues or require another labour shift. Restaurant-level operating margin can therefore understate marginal contribution in spare capacity and overstate it at a constrained peak.
Use four operating checks:
- Daypart capacity: measure seats, covers, kitchen tickets, queue time and fulfilment limits by 30-minute interval.
- Channel displacement: identify whether orders moved between dine-in, takeaway, first-party digital and third-party delivery.
- Location displacement: for multi-site groups, check whether one site gained at another site’s expense.
- Reward substitution: determine whether customers would have visited and paid full price without the reward.
Behavioural research supports mechanisms, not a 15% benchmark
A longitudinal Journal of Marketing study of a convenience-store franchise found heterogeneous responses: heavy buyers redeemed without substantial behavioural change, while moderate and low buyers increased purchasing over time. It was observational, published in 2007 and was not restaurant-specific.
A coffee-shop field study on goal-gradient behaviour found that purchasing accelerated as customers approached a reward and that endowed progress increased completion. This supports a plausible reward mechanism, not a universal uplift percentage.
Scale does not establish causality. McDonald’s FY2025 Form 10-K and Yum China’s FY2025 Form 10-K disclose substantial member activity, but member sales share is affected by self-selection and neither filing supplies a randomised counterfactual for a 15% claim.
Payment-terminal customer recognition can reduce journey friction within controlled boundaries
“Terminal-resident loyalty software” is a common search phrase, but Zeal’s accurate category is a value-added services layer for payment terminals.
A payment-terminal recognition journey can, where the exact device, payment application, PSP deployment and acquirer permissions allow it:
- Identify: invite an approved account, QR or barcode identifier before or alongside payment, without treating a payment credential as proof of one person.
- Engage: display an approved enrolment, offer, survey or digital-receipt journey using non-sensitive context.
- Retain: post a permitted result or reference to a programme ledger, then let merchant systems measure subsequent behaviour.
A VAS application should not capture PAN, PIN, track data, cryptograms or payment keys, replace the certified payment interface, alter scheme-required receipt fields or control settlement. J.P. Morgan’s terminal application documentation illustrates the boundary between on-device merchant applications and protected payment applications. PCI SSC’s standards overview also distinguishes device, PIN, payment software, P2PE and PCI DSS layers.
Deployment is governed by the production estate. PSPs deploy approved applications and configurations, commonly through a TMS or curated application process. Payment App Vendors support the certified payment build and permitted interfaces. Acquirers and processors retain merchant boarding, acquiring connectivity and settlement responsibilities. ISOs may distribute or service an estate, but should not be described as deploying unless the evidence for that estate proves it.
This architecture can reduce a prompt’s dependence on a separate app or manual phone-number entry, but it does not by itself prove higher enrolment or repeat visits. Figures for app-download refusal rates, anonymous-transaction share or terminal-recognition enrolment lifts should be treated with caution unless they carry a named, methodologically transparent source.
Merchant dashboards should expose economic evidence, not vanity metrics
Merchant dashboard customer insights should connect behaviour to the unit model. Separate total and identified visits, unique customers, repeat visits, AOV, reward cost, refunds, channel mix, capacity and contribution. Preserve location, MID, TID and programme mappings without implying that the VAS application controls settlement. Estate visibility may support merchant-health analysis, but does not prove prevented churn.
SKU-level personalisation requires an EPOS or order-system feed, a stable identity link, governance and merchant permission. Payment amount alone does not reveal purchased items, so do not claim SKU history from payment-terminal logs without a confirmed data flow.
A credible case study needs a controlled method and contribution outcome
Any 15% uplift claim needs primary evidence behind it. The minimum methodology is:

- A precise customer, visit, repeat window, member, store and channel definition, including whether 15% is relative or percentage points.
- At least 8 to 12 weeks of pre-period data, preferably a full seasonal cycle, with observation dates and sample size.
- Total and identified visits, unique customers, repeat visits, AOV, reward cost, refunds and anonymous share.
- A randomised member or store rollout where feasible, or matched cohorts, difference-in-differences and pre-trend checks where it is not.
- Intent-to-treat reporting, not a result limited to active redeemers.
- Controls for pricing, promotions, openings, closures, channel and daypart mix, weather, holidays, local marketing and capacity.
- Identity match rate, duplicates, merges, token fragmentation and location-mapping completeness.
- Incremental sales and contribution after rewards, fulfilment, capacity, liability movement and any cross-location clearing.
- An effect estimate, confidence interval and independent Data, Finance, Product and Legal sign-off.
What should operators and PSPs decide next?
- Treat repeat visits as a unit-economics hypothesis, not a marketing vanity metric.
- Model 15% as a relative scenario alongside lower and higher cases, never as an industry promise.
- Calculate contribution after food, labour, packaging, payment, channel, reward, programme and capacity costs.
- Measure capacity and cannibalisation by daypart, channel and location before scaling an offer.
- Use controlled cohorts and intent-to-treat reporting before attributing behavioural change.
- Evaluate payment-terminal recognition as one possible low-friction VAS journey, subject to estate, certification, privacy and partner controls.
Frequently asked questions
Is a 15% increase in repeat visits a restaurant industry benchmark?
No. It is a useful sensitivity scenario, not a verified industry benchmark. Define whether it is a relative increase, a percentage-point change or a member-only result. Any case-study statement needs the baseline, comparison group, observation dates, sample size and effect estimate.
How does repeat frequency affect customer lifetime value in a restaurant?
Higher frequency can increase lifetime revenue and contribution if AOV and margin remain adequate. Calculate contribution per order multiplied by visit frequency and measured customer lifespan, then deduct acquisition, reward and programme costs. If contribution per order is not available, use AOV multiplied by the incremental contribution-margin rate, frequency and measured lifespan. Avoid assuming that a more frequent member is incremental, because high-frequency guests are also more likely to self-select into a programme.
Should rewards be deducted from revenue or contribution?
Model the economic substance consistently. Discounts may reduce recognised sales, while points or free items can create fulfilment cost and, depending on programme design and accounting rules, a contract liability. For the decision model, show gross incremental sales, margin before rewards, reward and programme cost, then net incremental contribution so the bridge remains auditable.
Can a payment terminal identify every returning customer automatically?
No. An approved terminal journey can support account, QR, barcode or controlled-token recognition, but permissions vary by device, Payment App Vendor, acquirer, PSP deployment and market. Cards and wallets may produce different tokens, and shared credentials can create false matches. Use explicit member identification as the primary model and document anonymous traffic.
Does a repeat-visit increase always improve restaurant profitability?
No. An extra visit can destroy value if it is heavily discounted, served at constrained peak capacity, displaces a full-price order or carries high delivery and fulfilment costs. Profitability improves only when net incremental contribution after food, labour, payment, packaging, rewards, programme cost, cannibalisation and capacity cost is positive.
What is the minimum test period for a repeat-visit case study?
Use at least 8 to 12 weeks of pre-period data and a comparable post-period, but prefer a full seasonal cycle where trading varies materially. A valid design also needs a control or matched comparison, pre-trend checks, location and channel stability, identity-quality reporting and confidence intervals. Duration alone does not establish causality.
Source note
This article reflects public information and source material available as at 8 August 2026. Public-company results are reporting-period disclosures, not Zeal outcomes or universal restaurant benchmarks. The 15% repeat-visit figure is used throughout as an illustrative scenario, not a measured Zeal result or an industry benchmark. No citation implies a commercial relationship between Zeal and any named organisation.
To test the model against your estate’s visits, margin, capacity and reward assumptions, book a partner walkthrough with Zeal.
You might also like

